Half-year results | Nordea
This report reflects the performance of the company during the first six months of the fiscal year and highlights key financial indicators and business developments.
Nordea
2023
Nordea

Disclaimer This presentation contains forward-looking statements that reflect management's current views with respect to certain future events and potential financial performance. Although Nordea believes that the expectations reflected in such forward-looking statements are reasonable, no assurance can be given that such expectations will prove to have been correct. Accordingly, results could differ materially from those set out in the forward looking statements as a result of various factors. Important factors that may cause such a difference for Nordea include, but are not limited to: (i) the macroeconomic development, (ii) change in the competitive climate, (iii) change in the regulatory environment and other government actions and (iv) change in interest rate and foreign exchange rate levels. This presentation does not imply that Nordea has undertaken to revise these forward-looking statements, beyond what is required by applicable law or applicable stock exchange regulations if and when circumstances arise that will lead to changes compared to the date when these statements were provided.
- - - - -
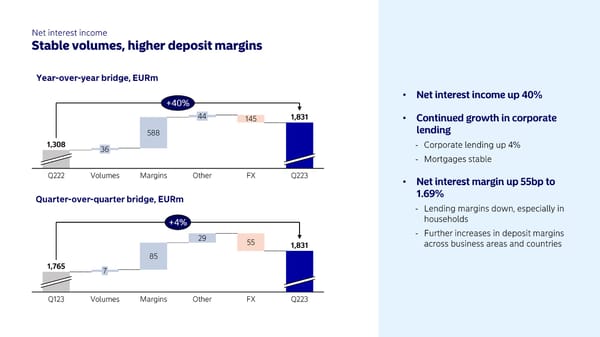
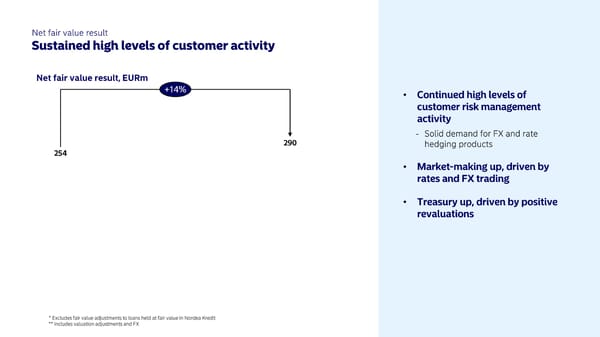
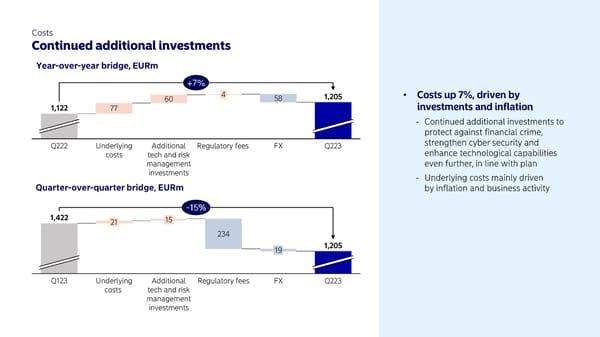
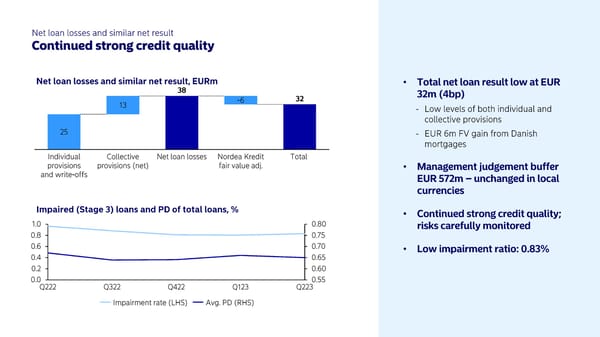
Key financials Second-quarter results 2023 Income statement and key ratios Q223 Q222 Q2/Q2 Q123 Q2/Q1 EURm Net interest income 1,831 1,308 40 % 1,765 4 % Net fee and commission income 751 797 -6 % 765 -2% Net insurance result 68 53 2 8 % 46 48 % Net fair value result 2 90 2 54 14 % 345 -16 % Other income 15 16 0 Total operating income 2,955 2,428 22% 2,921 1% Total operating expenses excl. regulatory fees -1,184 -1,105 7 % -1,167 1 % Total operating expenses -1,2 05 -1,12 2 7 % -1,42 2 -15 % Profit before loan losses 1,750 1,306 34% 1,499 17% Net loan losses and similar net result -32 56 -19 Operating profit 1,718 1,362 26% 1,480 16% Cost-to-income ratio excl. regulatory fees,% 40.1 45.5 39.9 Cost-to-income ratio*,% 42 .8 48.8 42 .7 Return on equity*,% 18.4 13.6 17.1 Diluted earnings per share, EUR 0.37 0.2 8 32% 0.31 19 % * With amortised resolution fees
- - - -
-
-
+7% - -
- -
- - - - - -
163 163 44
0 100 200 300 500 0,0 0,4 0,2 0,8 0,6 1,0 Assets under management, EURbn
Nordea 2025: The preferred financial partner in the Nordics I Updated outlook for 2023: return on equity comfortably above 15% I Reassessing long-term financial target for 2025 - update in conjunction with fourth-quarter report
Nordea
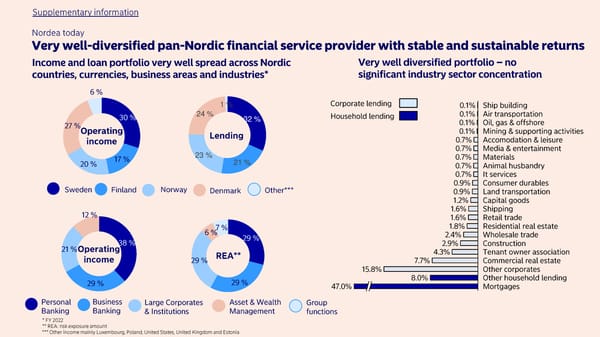
32 % 21 % 23 % 24 % 1 %
~ ~ - - - - - - - - -1.0 0.0 1.0 2.0 3.0 4.0 5.0 Q322 Q122 Q222 Q422 Q123 Q223 Q324 Q423 Q323 Q124 Q224 Q424 Sweden Denmark Norway Finland
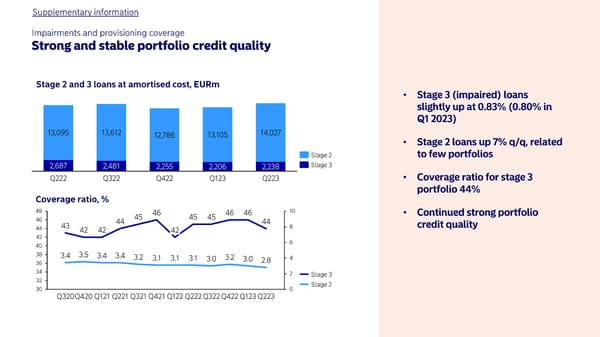
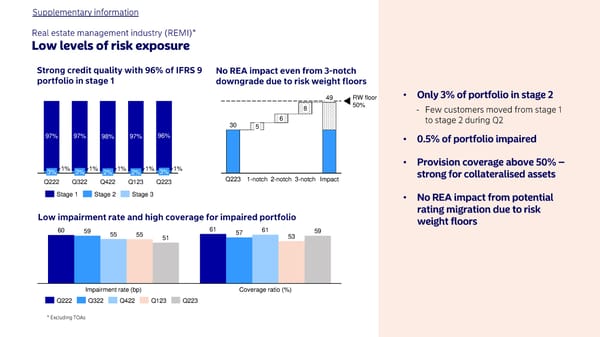
60 61 59 57 55 61 55 53 51 59 Impairment rate (bp) Coverage ratio (%) 1% 1% 1% 1% 1% 97% 97% 98% 97% 96% 3% 3% Q222 Q322 2% Q422 2% Q123 3% Q223 Stage 1 Stage 2 Stage 3 30 Impact Q223 8 1 - notch 5 2 - notch 6 3 - notch RW floor 50% 49 - Q222 Q322 Q123 Q422 Q223
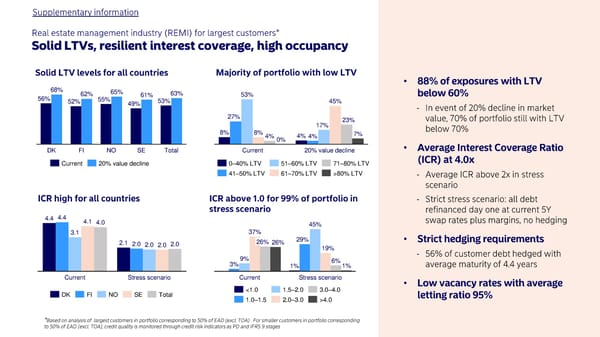
* - - - - 4% 27% 20% value decline Current 8% 4% 53% 8% 0% 4% 17% 45% 23% 7% 0 40% LTV 51 60% LTV 71 80% LTV 41 50% LTV 61 70% LTV >80% LTV DK FI Total 52% NO 62% SE 56% 68% 55% 49% 65% 61% 53% 63% 20% value decline Current 4.4 2.1 4.4 2.0 3.1 2.0 4.1 2.0 4.0 2.0 Stress scenario Current DK NO FI Total SE 19% 26% Stress scenario 1% Current 3% 9% 37% 26% 29% 45% 6% 1% 1.5 2.0 <1.0 1.0 1.5 3.0 4.0 2.0 3.0 >4.0