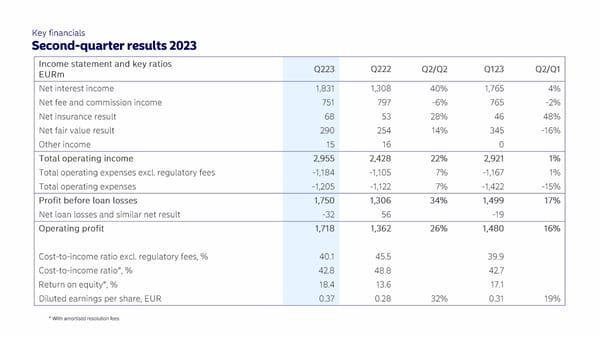
Key financials Second-quarter results 2023 Income statement and key ratios Q222 Q223 Q123 Q2/Q2 Q2/Q1 EURm 1,831 1,308 1,765 Net interest income 40% 4% 751 797 -2% Net fee and commission income -6% 765 Net insurance result 53 28% 46 68 48% 290 -16% 254 345 14% Net fair value result 16 15 0 Other income 2,428 2,921 Total operating income 22% 2,955 1% -1,184 -1,105 1% 7% -1, 167 Total operating expenses excl. regulatory fees -1,12 2 -1,42 2 -1,2 05 -15% 7% Total operating expenses 1,499 1,750 1,306 34% 17% Profit before loan losses -19 -32 Net loan losses and similar net result 56 1,718 1,362 26% Operating profit 16% 1,480 40.1 39.9 Cost-to-income ratio excl. regulatory fees,% 45.5 42 .7 Cost-to-income ratio*,% 42 .8 48.8 17.1 13.6 18.4 Return on equity*,% 0.31 0.37 19% Diluted earnings per share, EUR 0.2 8 32% * With amortised resolution fees
 Half-year results 2023 | Nordea Page 3 Page 5